A fresh perspective
Prior to joining Finit and the OneStream Software community, I spent my career focused on designing and building Essbase and Hyperion Planning Solutions. Both Planning and Essbase were well-established tools, both built upon a multi-dimensional database in which we had dimensions, hierarchies, and members. In order to work with data in those technologies, it must all be loaded to the cube and contained within the dimensions. OneStream’s unique platform architecture presents a paradigm shift that expands the possibilities for working and reporting. I realized that with the newest features available in the platform, it is now more important than ever to be a trusted advisor and partner to our clients and prospective clients.
That means that we must continue to educate ourselves and go above and beyond for our clients by leveraging the latest and greatest functionality from OneStream Software.
The ways that we can analyze and report on data in OneStream are seemingly endless; and, while there are some parallels we can draw to legacy Hyperion products, there are new ways of doing things that are unique to OneStream. With the 5.2 version released in October of 2019, the possibilities grew. We can now consume more data in OneStream and in different ways than ever before. I truly believe that OneStream is now in a league entirely of its own, and therefore, our role in communicating with clients about OneStream must change.
It would be a tremendous disservice to a new OneStream customer to simply replicate what they have in another system. At Finit, we set ourselves apart by having meaningful conversations from the beginning to help that drive innovative application design tailored to their business situation and long-term needs.
The role we must take on is that of an educator. This platform, in my opinion, is truly something different. It is no longer enough to simply compare it to other products. It is no longer enough today just to ask a client how many reports they have. We must open a new conversation with them, understand their business needs, and identify what questions they are asking of their data, so that we, as the product experts, can recommend how they consume it using this unique and powerful platform.
What’s possible in OneStream?
My goal is to give you an overview of what’s possible in OneStream and to help clarify some terminology that may be new or confusing in the market.
I’ll share examples of the items below so conversations in these areas can be more effective. You can also find additional information and definitions for many of the terms below in one of our previous blogs entitled, “OneStream Integration & Reporting: Terminology 101“.
- Drill-down
- Drill-back (sometimes called drill-through)
- Data-load path/data lineage
- Reporting on cube data
- Reporting on stage data
- Reporting on cube & stage data together (relational blend)
- Analytic Blend
Before we explore these approaches, let’s do a very quick 20,000-foot overview of what’s in a OneStream application, specifically all the places where the data can live and in what state.
As you may already know, a OneStream application is built entirely inside of a single MS SQL Server DB (…that is, until Analytic Blend, but more on that later). Inside that database, you guessed it, are lots of tables. Tables for metadata, tables for fact data, tables for application artifacts (forms, workflow profiles, etc.). Some of those tables represent the Stage (relational, pre-cube data), others represent XF MarketPlace solutions, and others represent the cube(s).
Here are the types of data we’ll consider for this blog post/series:
- Pre-mapped stage data (relational)
- Post-mapped stage data (relational)
- XF Marketplace app data (relational)
- Cube data
- Child cube
- Parent cube
The ways we can report on data in those various states of existence are as follows. Relational (stage, XF MarketPlace):
- SQL queries via data adapters, presented in dashboards
- Pivot viewer (new for 5.2)
Cube data:
- Cube views
- Dashboards, via data adapters
- Excel add-in
Terms and possibilities
Before we can truly decide on the best way to report on the data or present the data to our users, we must understand the data lineage within OneStream so that we can decide where the different levels of data detail belong. We should carefully consider the different data elements and ask the following questions:
- Do they belong in the cube?
- Should they remain in the stage?
- Should they remain in the source system? -or-
- Should they be loaded to the Analytic Blend engine?
The focus of the rest of this post is data lineage through the drill-down and drill-back processes.
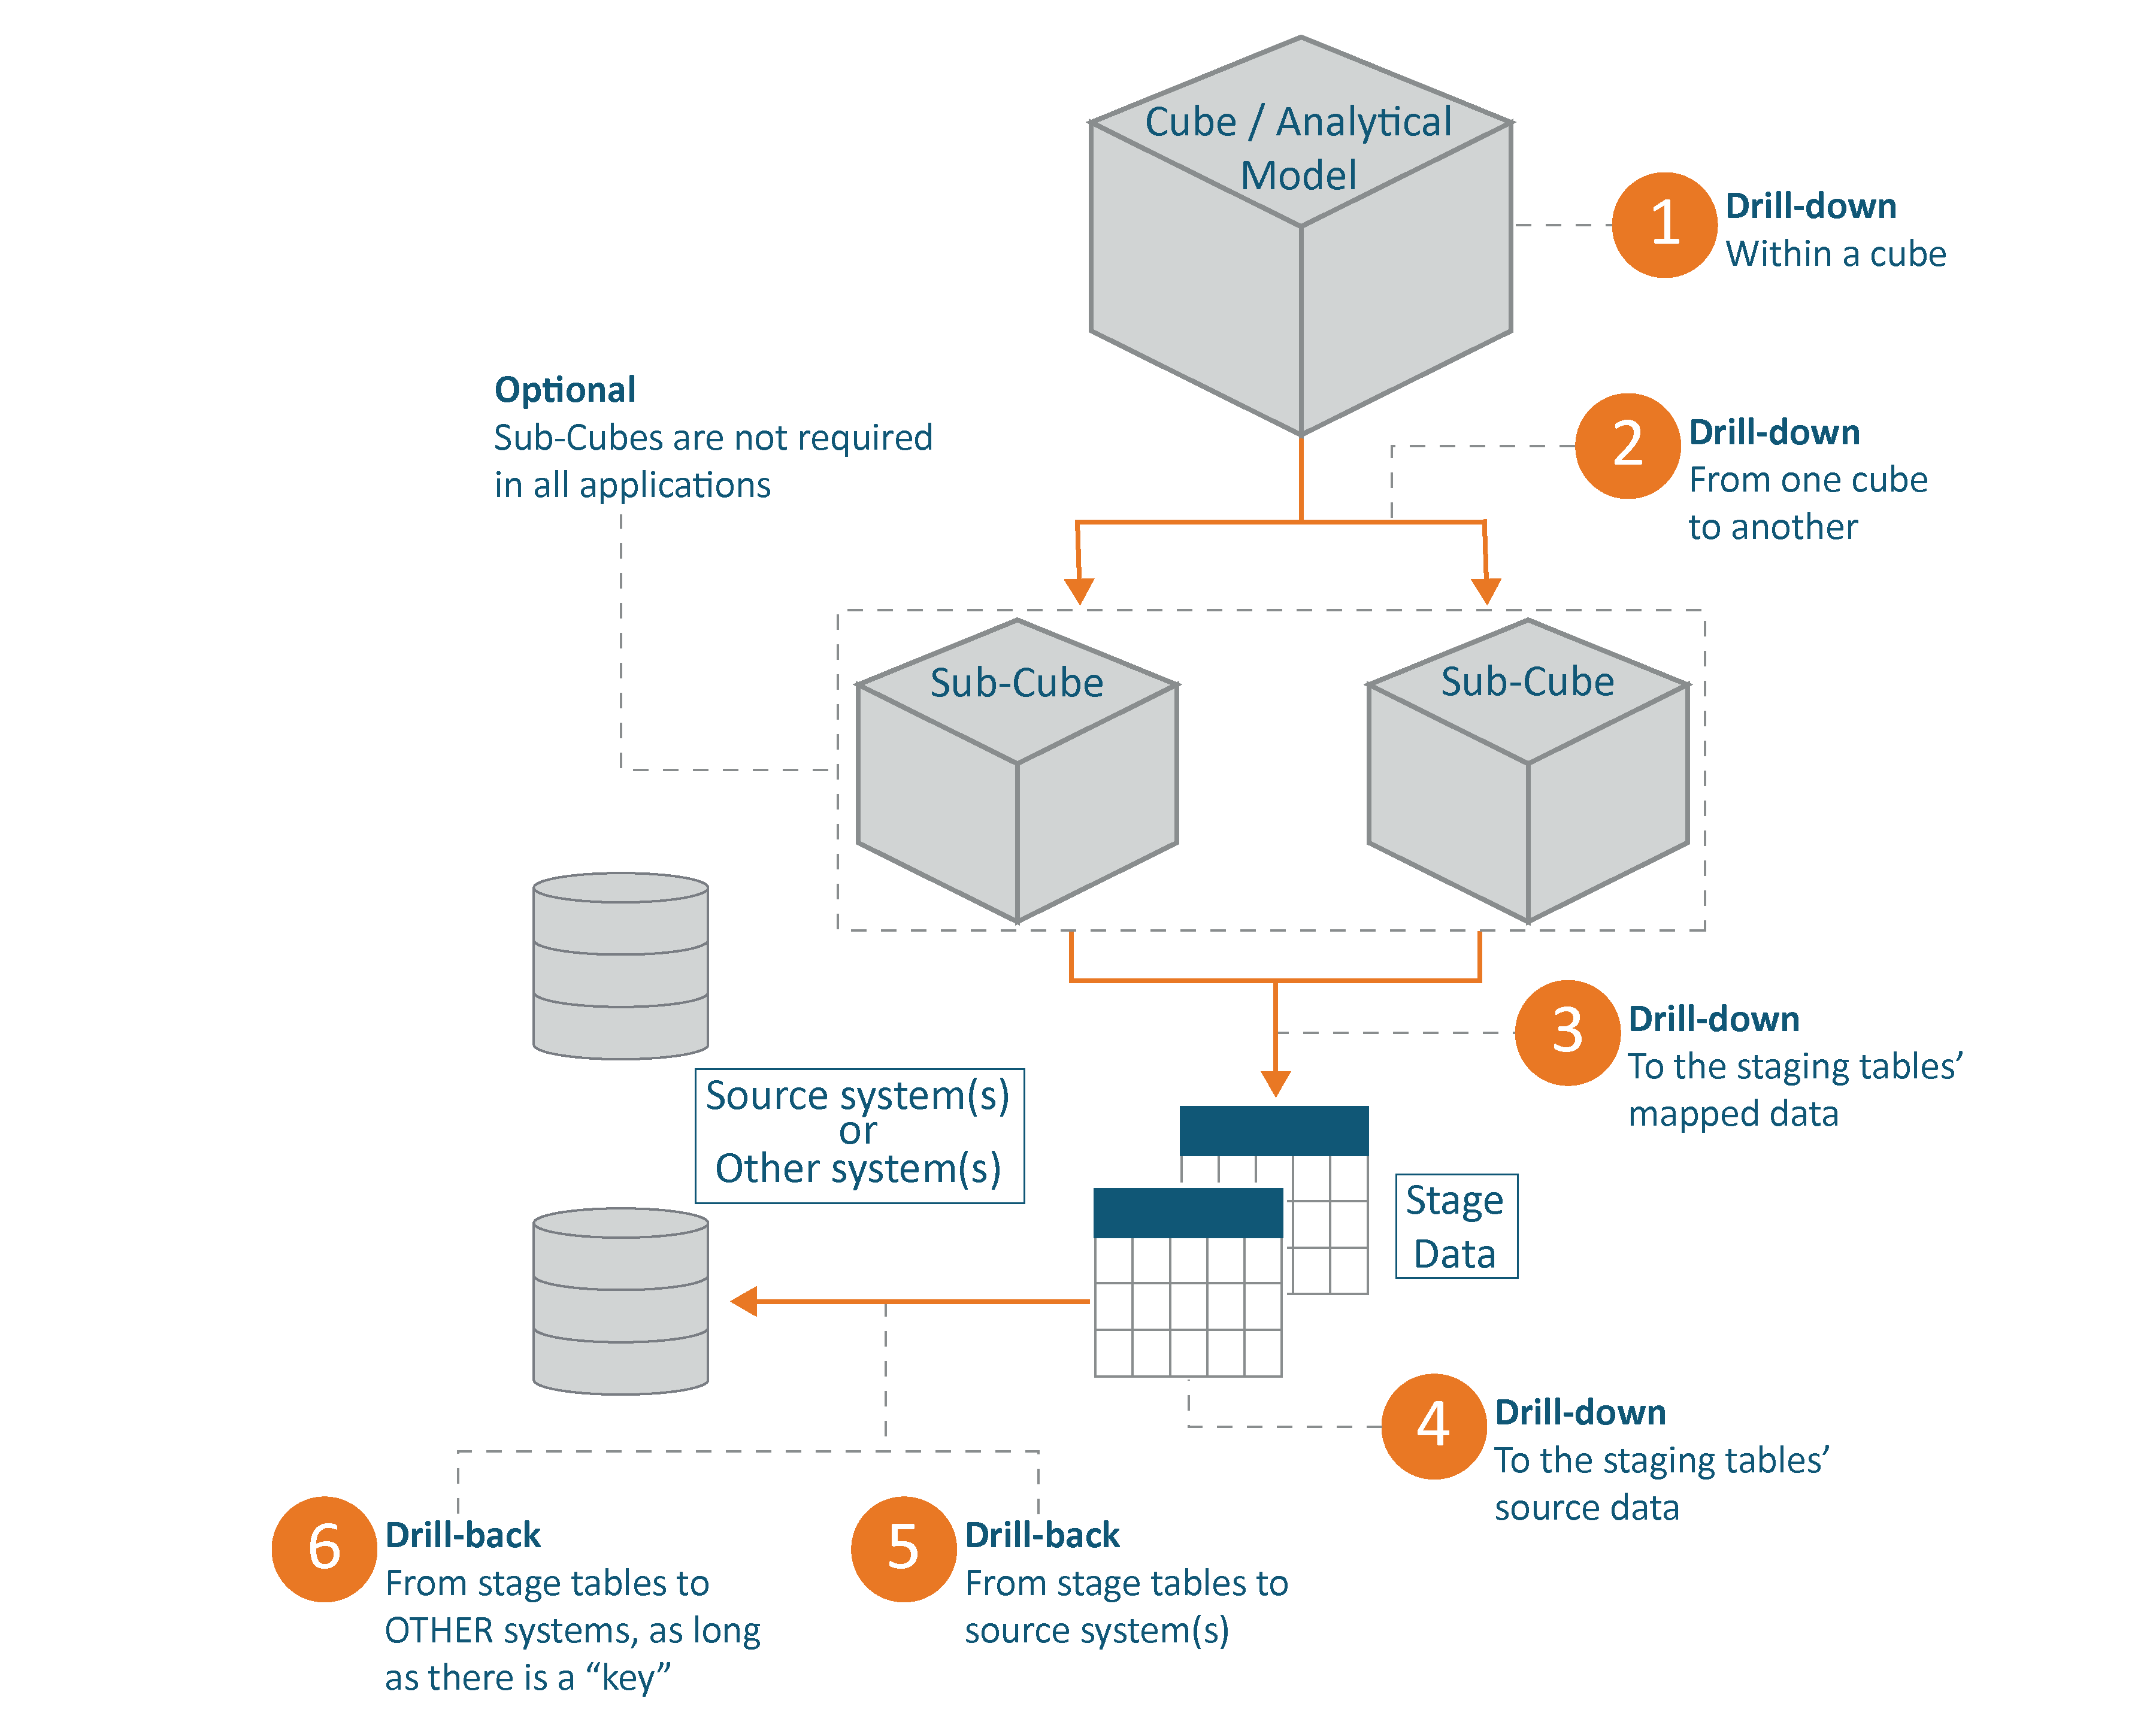
When we load data to a OneStream application we create data lineage. This is the nature of the platform. Within the OneStream application, data makes its first stop at the pre-mapped stage, then the post-mapped stage, then the cube(‘s) first child, and then parent cube, if applicable.
In the reverse direction, let’s explore the drill-down path. We drill down within a single cube through the hierarchy, from ancestor to descendants. Then, if we’ve employed extensible dimensionality, we can drill down to a child cube for a more granular level of detail. Once we’ve reached the lowest level of cube-data, the next step in the drill-down path is post-mapped stage data. The last step within the OneStream application itself is the pre-mapped stage data, as initially loaded from the source.
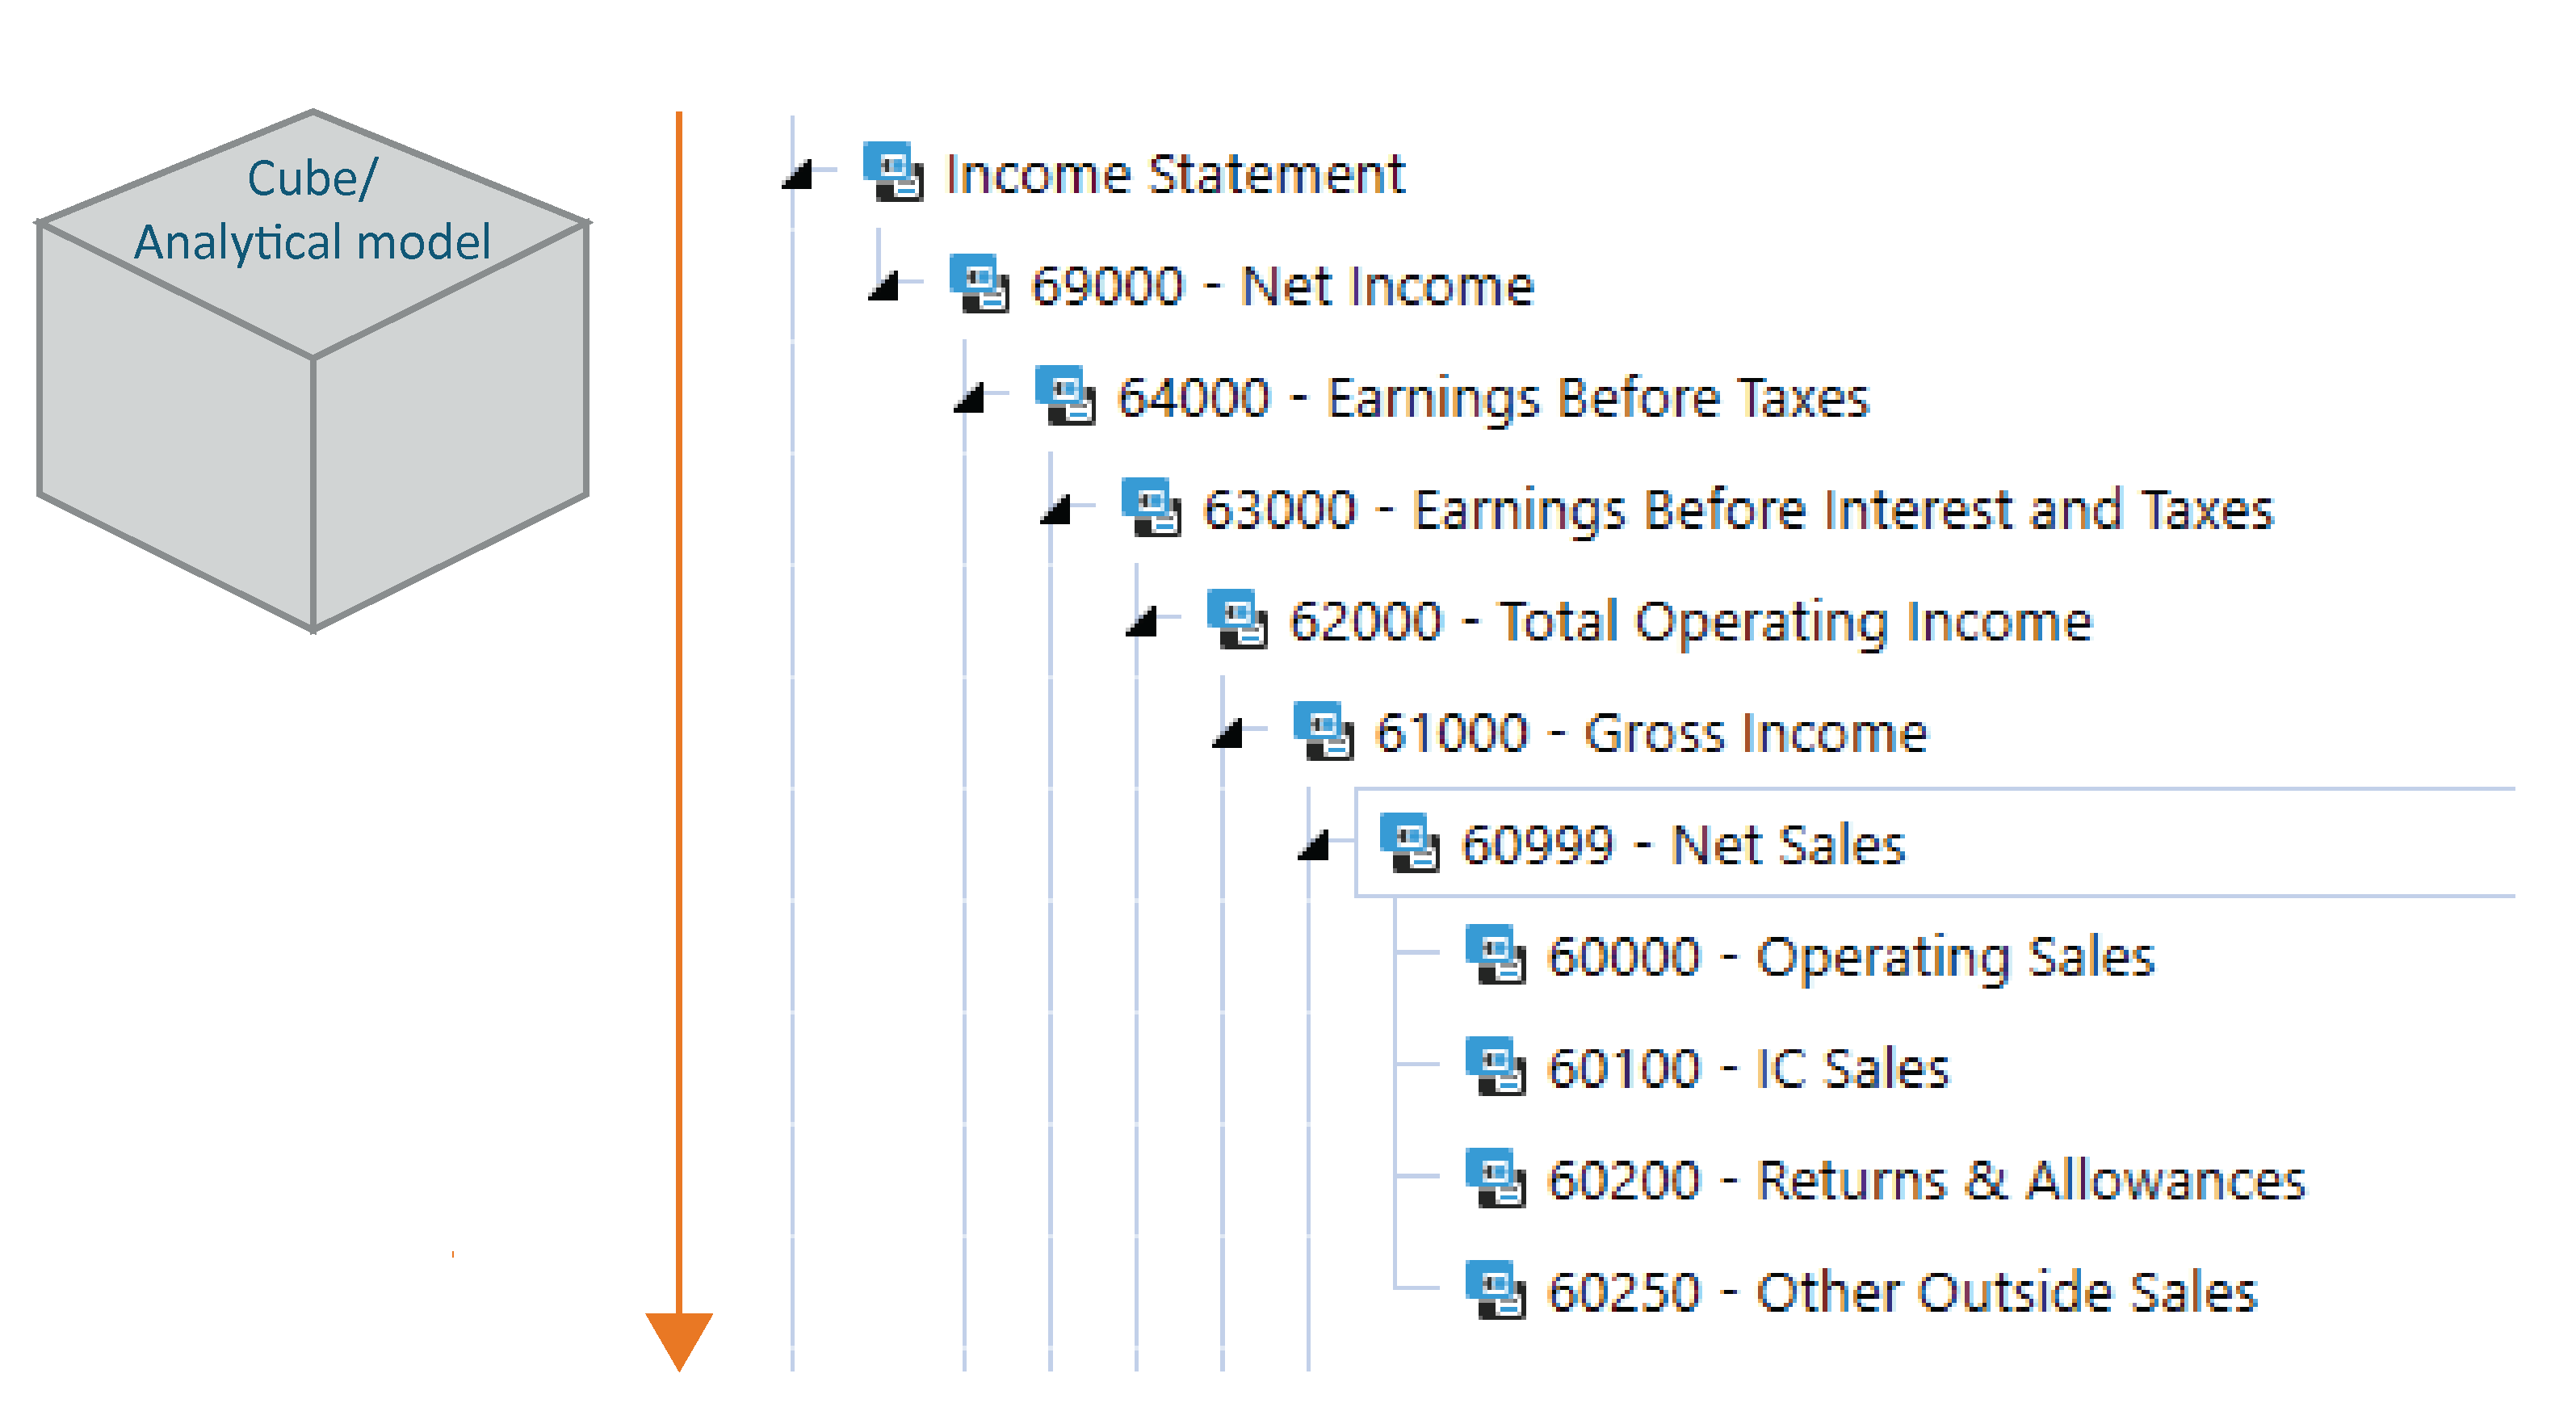
When we drill down within a cube, we are following the hierarchy established in the outline.
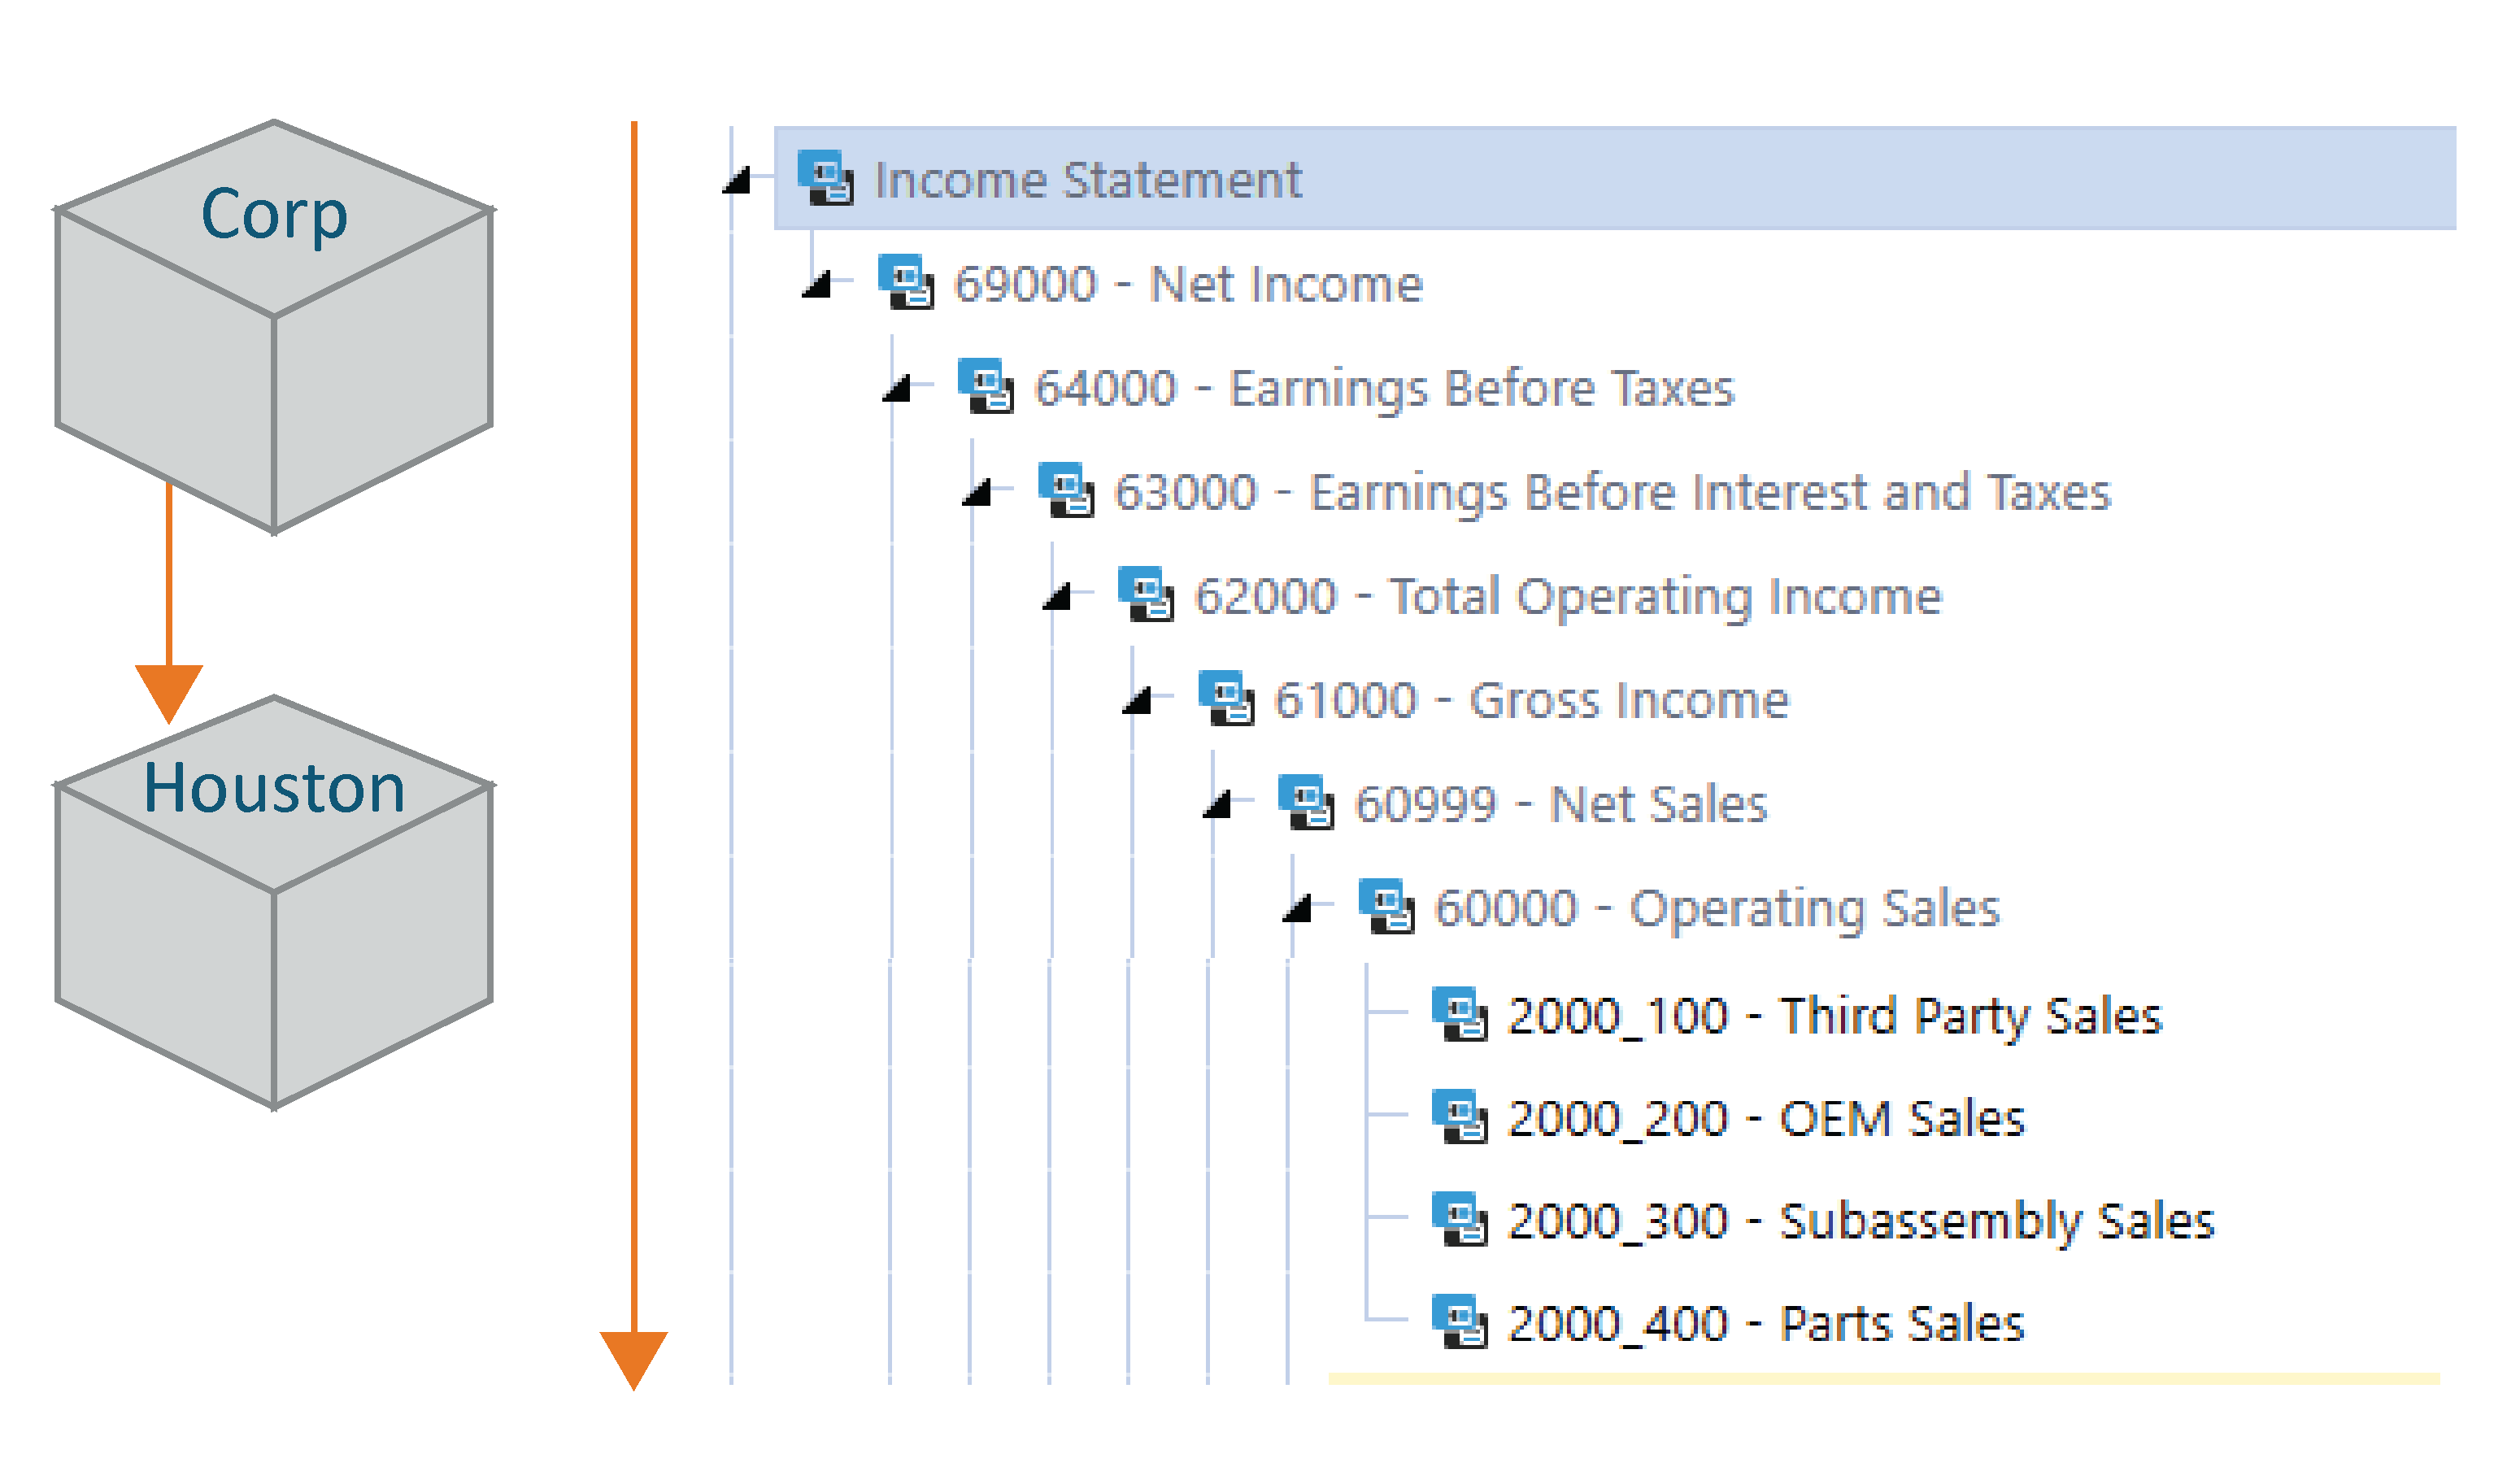
If we’ve employed a multi-cube design leveraging extensible dimensionality, our next drill-action might be from a parent cube to a sub/child cube as pictured below. Notice in the image of the outline there are some members which appear to be greyed out and others which are clear and black. The greyed-out members belong to the parent cube and the child cube is “extended” to include the members in black.
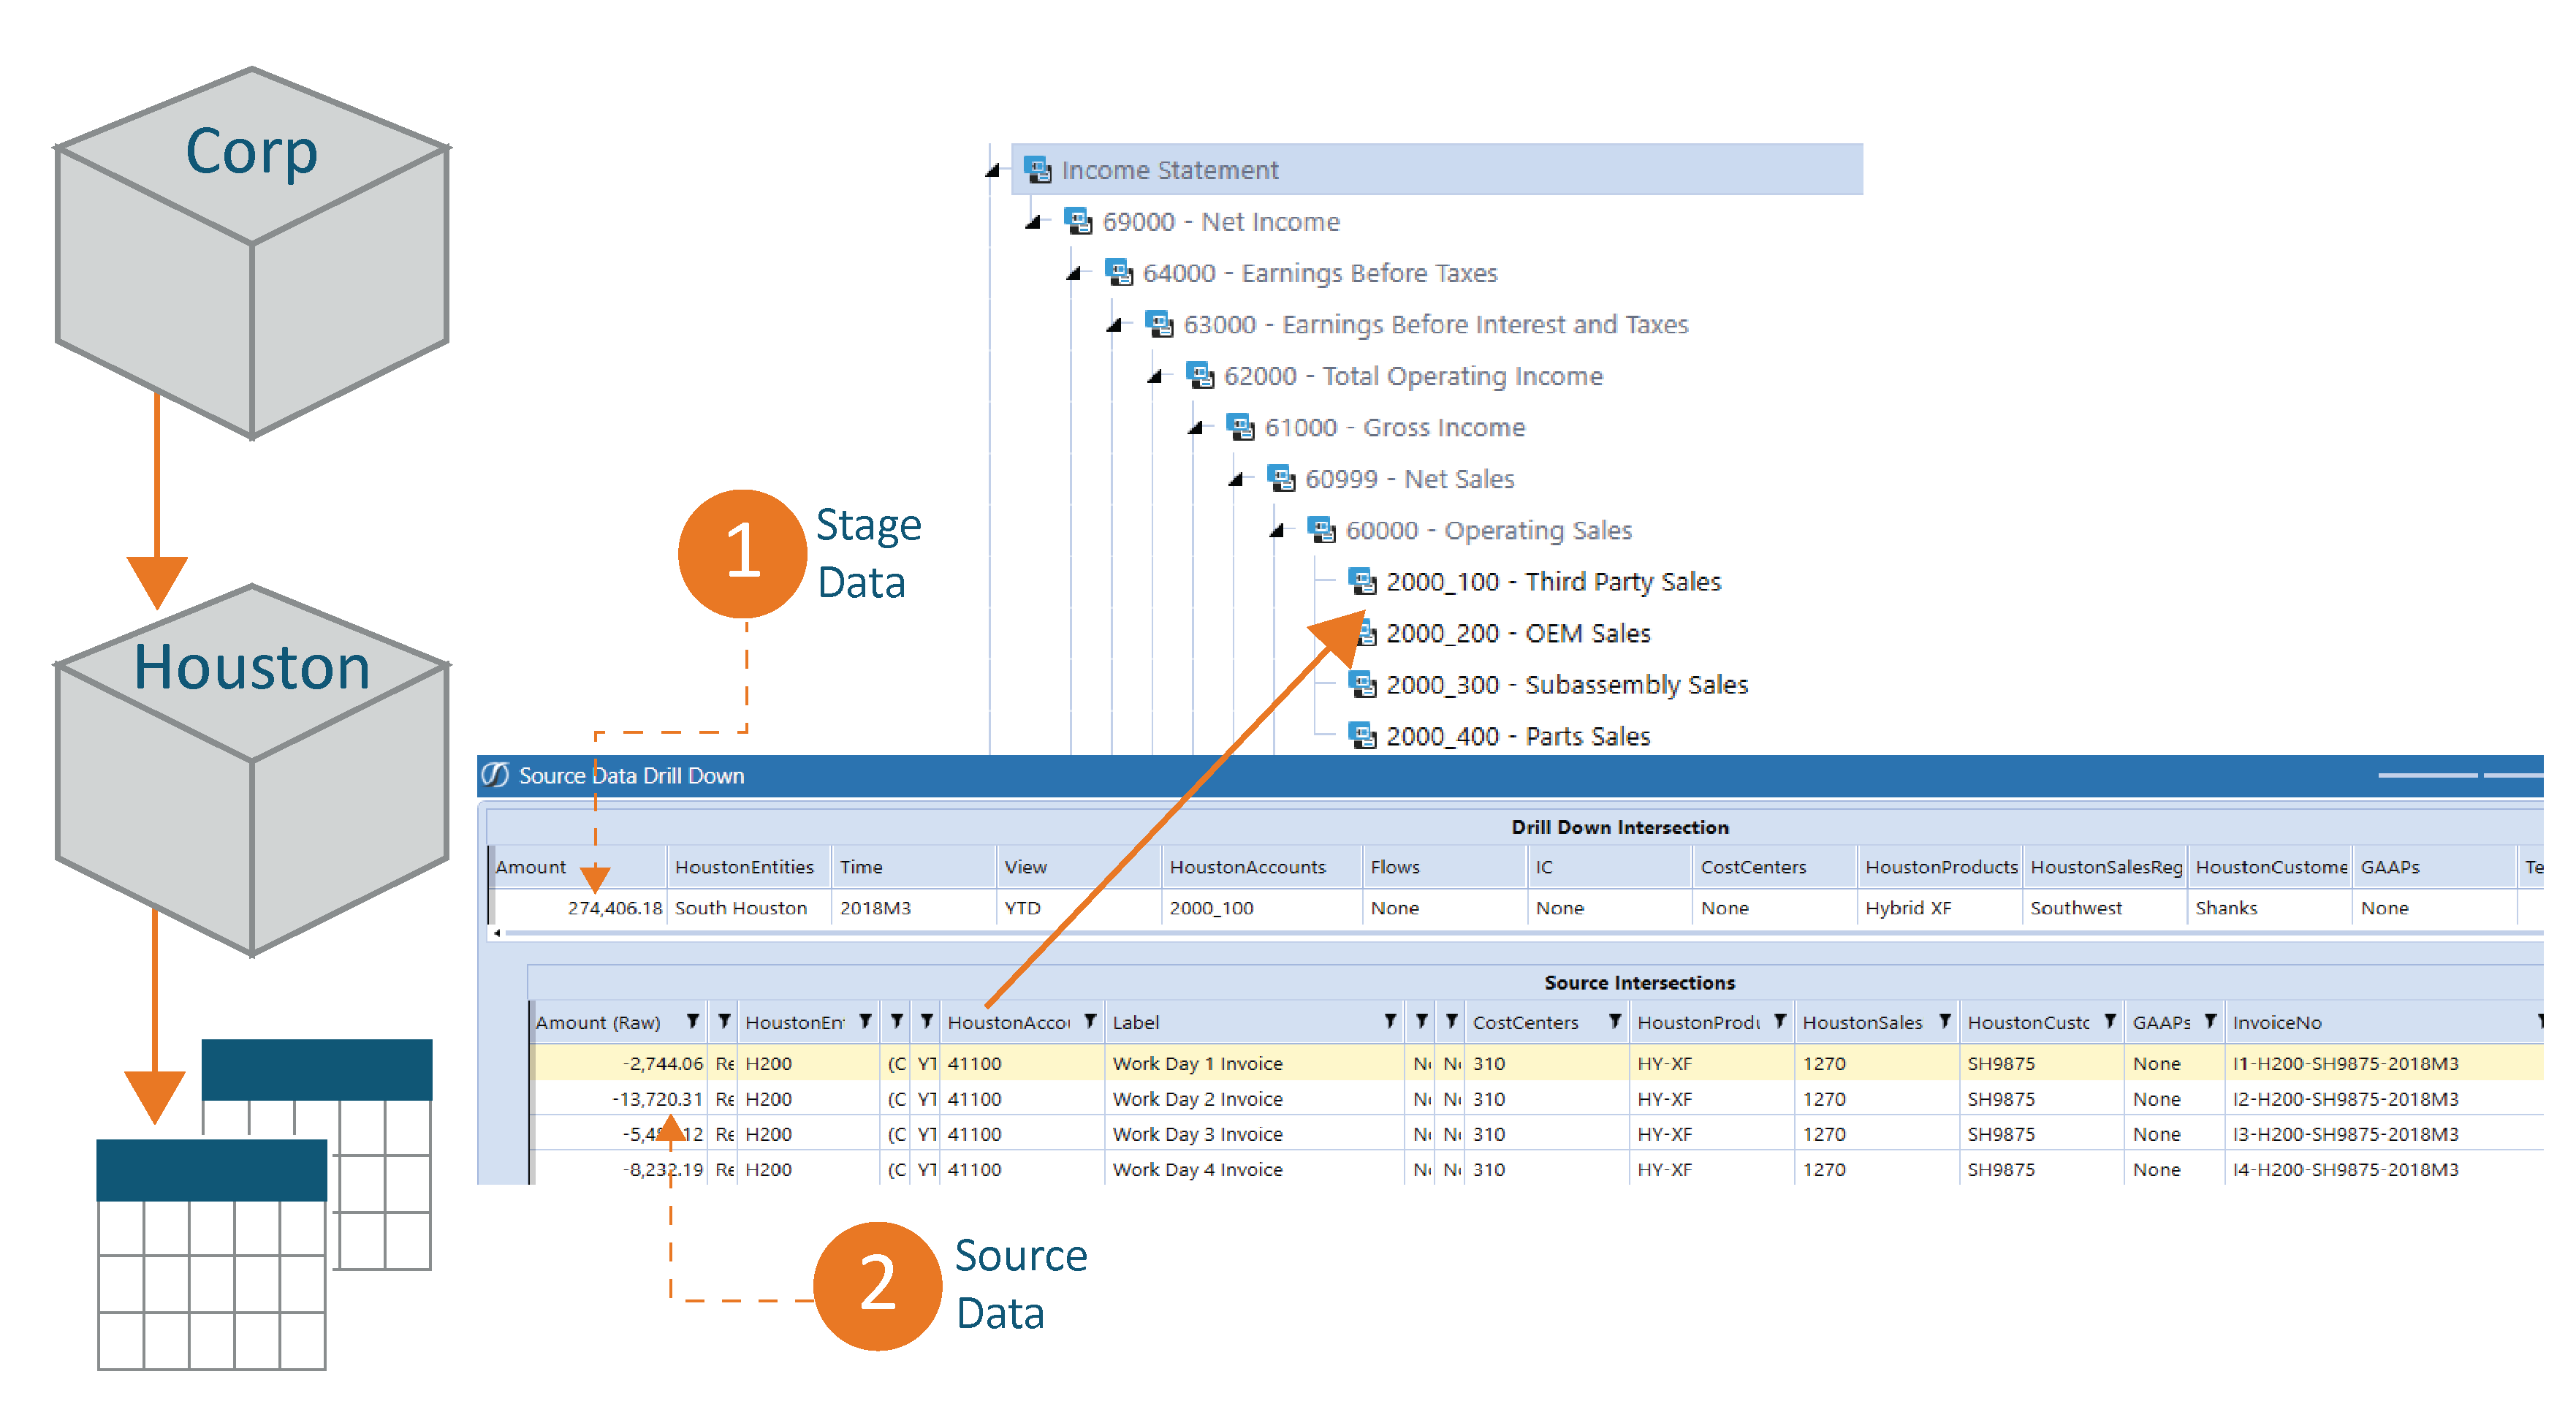
Next, we can drill down to the Stage, where we will first be presented with the transformed data (1) and then should we continue to drill, we will be presented with the source data as it was initially loaded to the OneStream application (2).
We then arrive at an important step, identified by a term which is often misused or confused with drill-down. That term is “drill-back” or “drill-through”. There is an important distinction that must be made between drill-down and drill-back/through. Drill-down always occurs within the OneStream application while drill-back/through will return data queried from another, separate system, e.g. a GL system from which we’ve sourced our trial balance data.
Drilling back to the source system can return supporting detail to the application data. In the example below, the drill-back returns the Material Detail which tells us the customer, unit price, and number of units by product by type (Carbon shaft, graphite shaft, steel shaft, and head material). In the design of this solution, it was decided that this level of detail was not required in the OneStream application itself, nor the analytic model within the application, but that a user would still need the ability to get to that information on an ad-hoc basis, and so this solution was designed using drill-back to enable the user to do so.
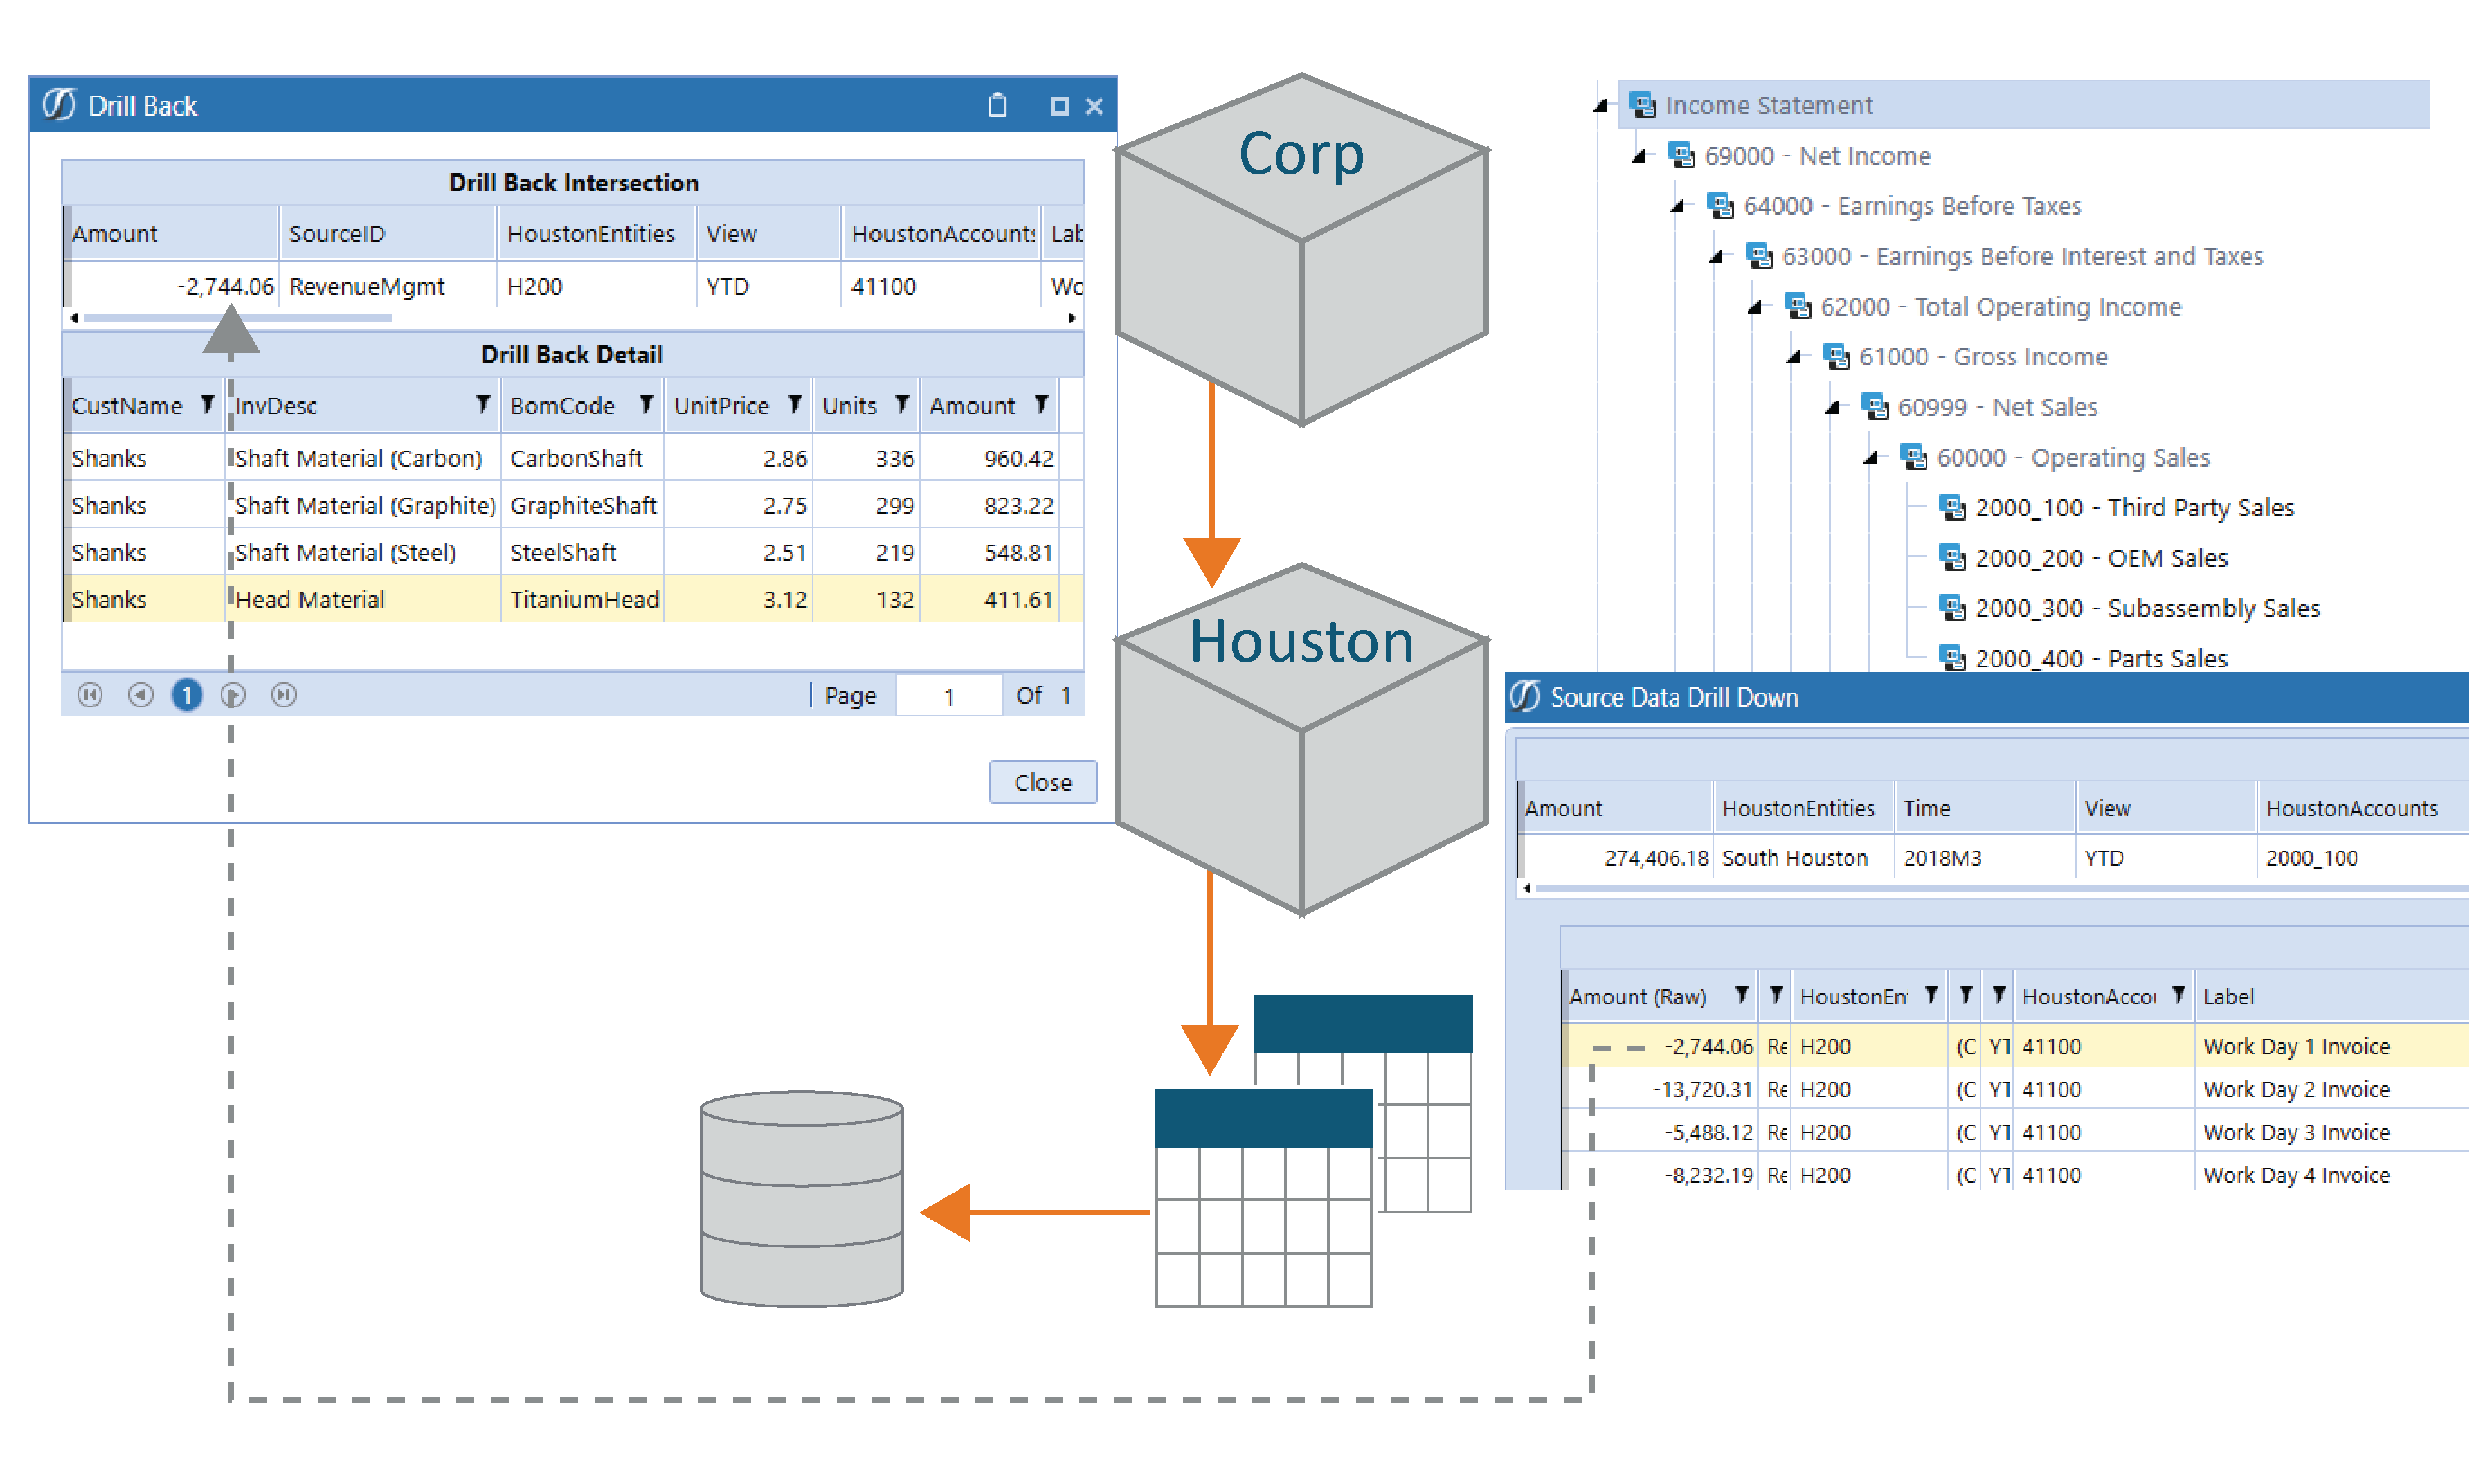
The drill-down and drill-back functionality described so far can be accessed via Cube Views, Dashboards, Spreadsheet, or Excel Add-In. It is important to note that the drill-down in the cube(s) will occur in the rows and/or columns of the report, while the drill-down to the Stage tables and drill-back to the source system will result in pop-up windows.
These out-of-the-box processes can sometimes be right-click intensive. To provide an even more seamless user experience we can create Dashboards–like the one pictured below–that interactively respond to the user’s behavior. For example, when the user clicks on a Balance amount on the left-hand side, the right will return results from a query to the stage tables to provide the account details. In this case, the summarized “Cash Deposits” amount is loaded to and stored in the Cube while the detailed account activity remains in the stage but is easily accessible.
We refer to this type of reporting as Relational Blend and it can commonly be used to report on data from specialty planning applications as well such as People Planning.

I hope that this post has been educational and has sparked even more curiosity or ideas on how to approach the design of your OneStream solution and reporting experience. If you’d like to discuss this topic or others in more detail before the next post in this series, please contact us Insights@finit.com.
Thanks for reading!
